Detecting Invasive Plants from Space · Part 1 of 3
The Signal Isn't in the Picture — It's in Time
May 2025
A Sentinel-2 satellite passes over Northern Virginia every five days. From 786 kilometers up, it photographs a square of land in thirteen spectral bands at ten meters per pixel. It cannot tell you whether the green blur at the edge of a wetland is common reed or native cattail. It cannot read a Latin binomial. It has no concept of “invasive.”
But it can tell you when things turn green.
That timing — which plants leaf out first in March, which hold their color deepest into November, which push their canopy so hard in August that the reflectance nearly saturates — turns out to be a kind of fingerprint. Invasive plants don't just look different from natives. They keep a different calendar. And a satellite, patient and precise, can read that calendar even when it cannot name the species.
This is the idea I decided to test last winter, sitting at my desk in the DC area with a laptop and a free Google Earth Engine account. The question was narrow and honest:
Can I detect known invasive plant hotspots in Northern Virginia using Sentinel-2 phenology alone — without ground truth, without machine learning?
The answer to that question, as of my first attempt, was: 1 out of 5.
The Problem I Was Trying to Solve
Northern Virginia has an invasive plant problem. Kudzu swallows fence lines along the Potomac. English ivy carpets the forest understory at Scotts Run. Phragmites — common reed — has displaced native marsh vegetation at Huntley Meadows and Dyke Marsh. These aren't obscure threats; they're documented, mapped, and well-known to anyone who walks these trails.
What I wanted to know was whether that same information could be extracted from orbit, at scales no ground survey could reach.
The reason this felt tractable in 2025, rather than aspirational, is Google Earth Engine. Before GEE, pulling six years of Sentinel-2 imagery over five sites would mean downloading roughly 20 terabytes of raw data, setting up local processing infrastructure, and solving a half-dozen preprocessing problems before writing a single line of analysis. On GEE, the entire pipeline — data access, cloud filtering, NDVI computation, time-series aggregation — runs in the cloud in a few dozen lines of Python. It turns a months-long infrastructure project into an afternoon experiment.
The Hypothesis
Different plants live on different schedules. Here is the core phenological logic I built the experiment around:
Early spring (March–April)
Many invasive shrubs and vines leaf out 2–3 weeks before native deciduous species. In March, a native hardwood forest is still dormant — gray branches, NDVI near 0.2. Kudzu and multiflora rose are already green. That contrast is measurable from space.
Summer peak (July–August)
Kudzu is almost comically aggressive. In high summer it pushes NDVI above 0.85 — a value almost no native canopy reaches. The forest is saturated with green, but kudzu is more saturated.
Late autumn (October–November)
Native trees drop their leaves in October. Many invasive species hold theirs into November, sometimes December. The gap is 2–3 weeks, but on a calibrated time series it shows up clearly.
Winter (December–February)
English ivy is evergreen. A deciduous forest in January collapses to NDVI ~0.3. An ivy-covered slope stays above 0.5 all winter. One of the clearest signals available.
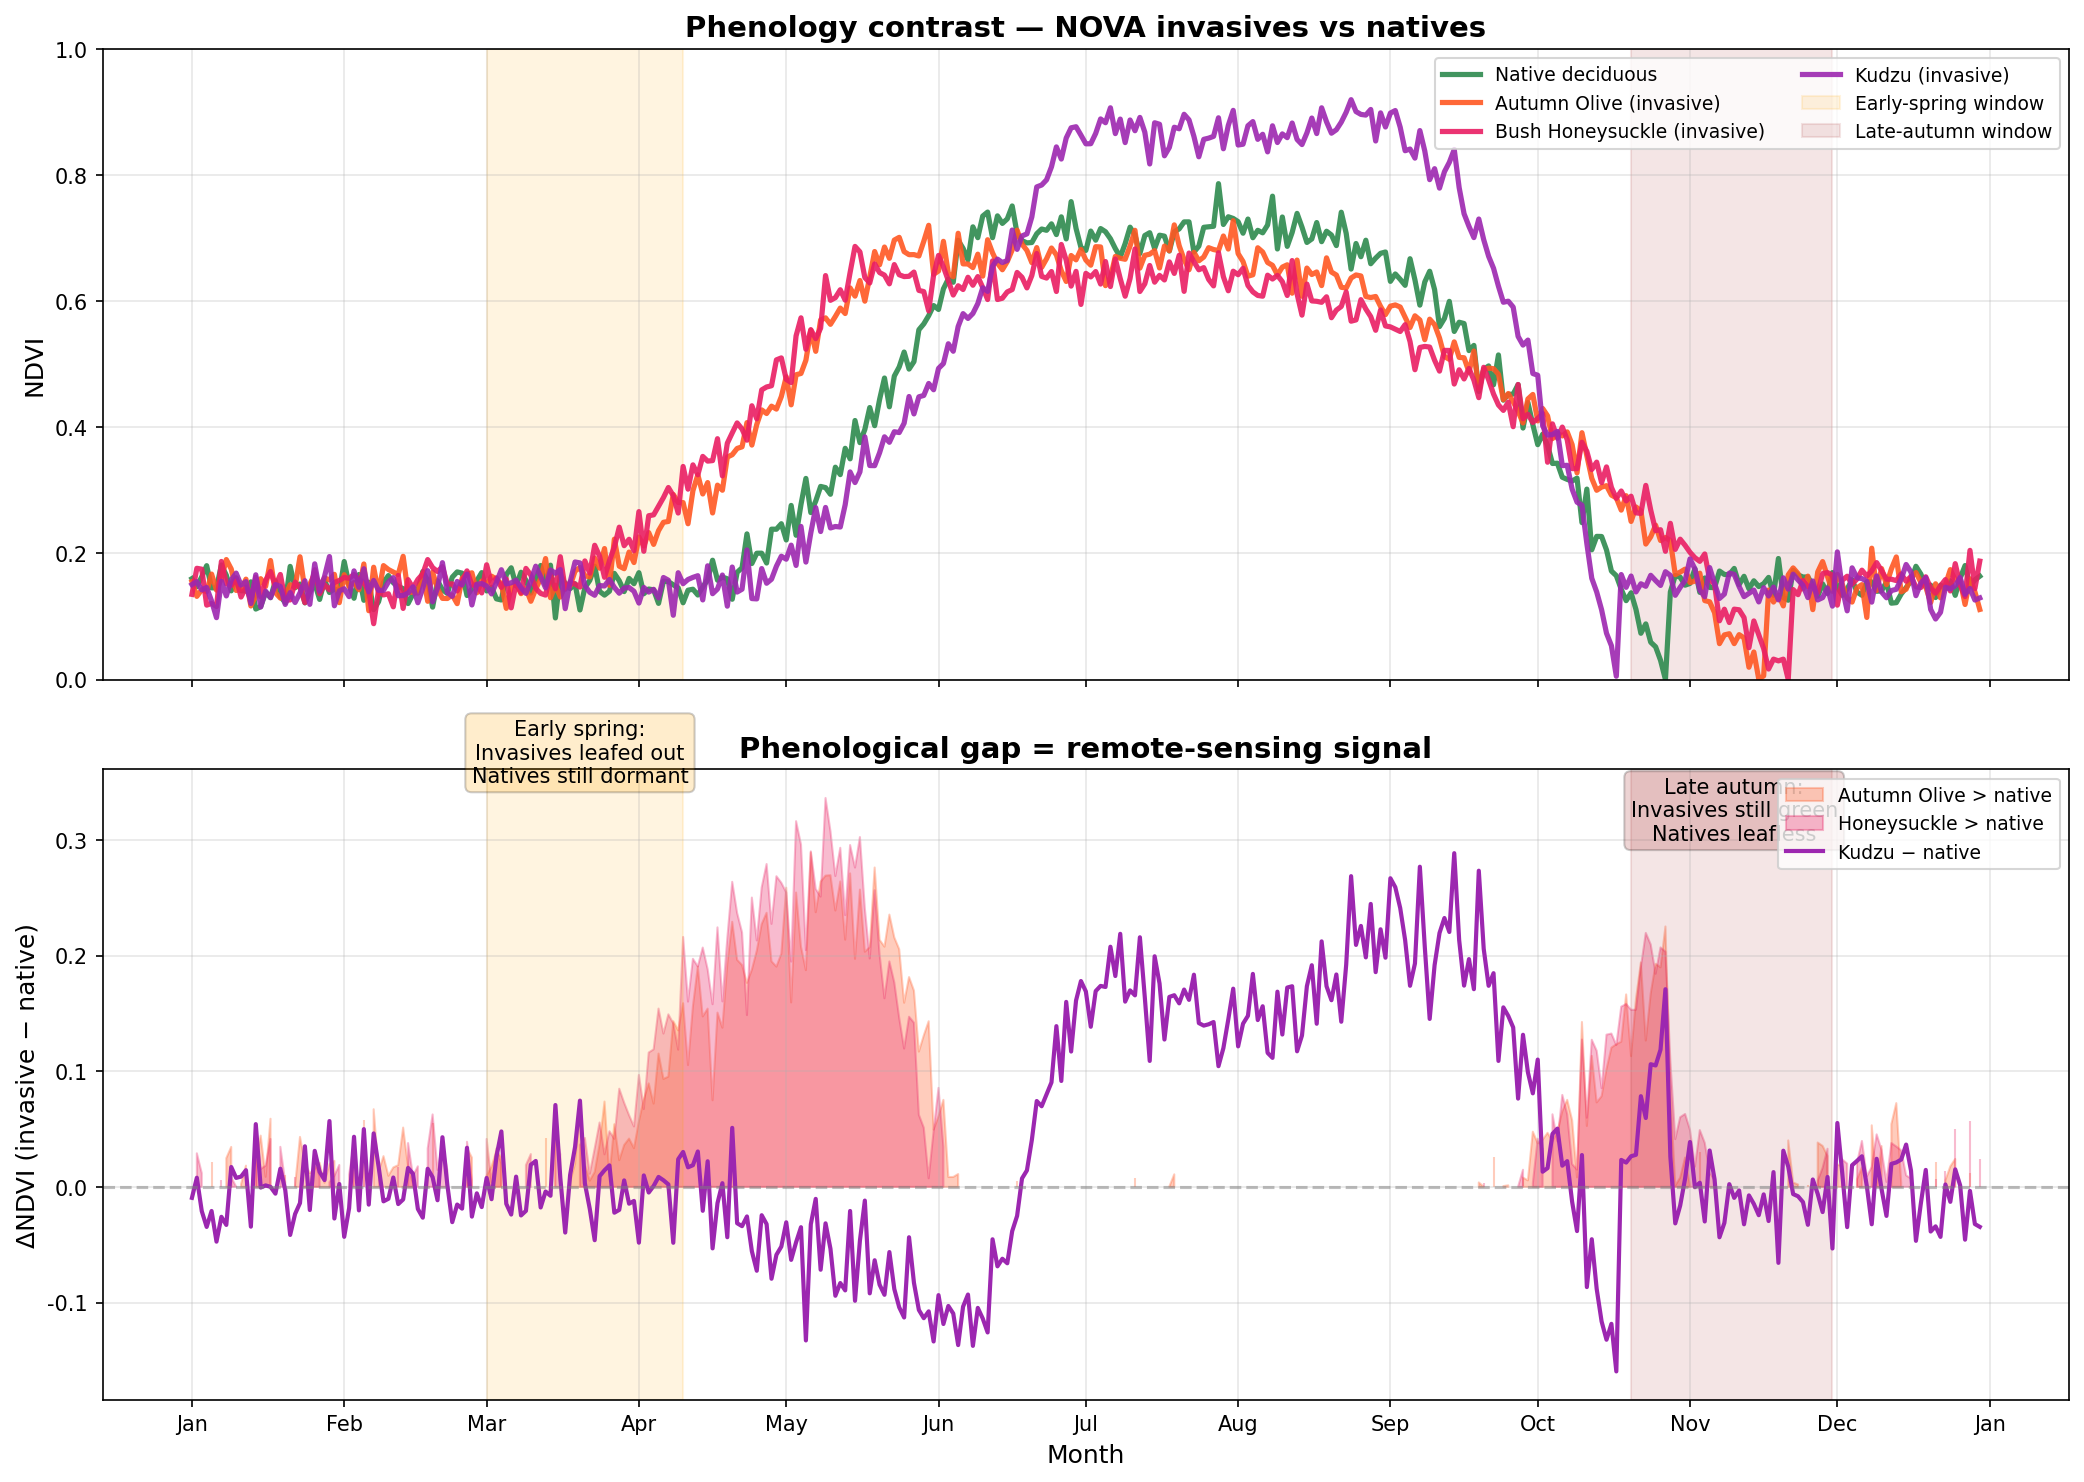
Simulated phenology curves showing the two main detection windows: early spring (invasives green up 2–3 weeks before natives) and late autumn (invasives hold leaves longer).
The Data
Satellite: Sentinel-2 Surface Reflectance (COPERNICUS/S2_SR_HARMONIZED), accessed via Google Earth Engine. I filtered for cloud cover below 30% and used a six-year window, 2020–2025.
Sites: Five locations in the DC area — Huntley Meadows Park (Phragmites), Scotts Run Nature Preserve (English ivy), Dyke Marsh Wildlife Preserve (Phragmites), Great Falls Park (kudzu), and Manassas National Battlefield as a native deciduous control.
Temporal resolution:Monthly median composites — the median NDVI of all cloud-free images per calendar month, per site. That's roughly 12 data points per year, 72 per site across the full period.
A methodological note:Monthly composites are a pragmatic choice. The cost is temporal resolution — if two species' phenological transitions both occur within the same calendar month, the difference gets smoothed away. A stricter analysis would use 8-day composites (Sentinel-2's native revisit cycle), which would catch finer-grained timing differences. That's a planned improvement. For this first pass, monthly composites kept the complexity manageable.
The Pipeline
The core GEE logic is short enough to show in full:
collection = (ee.ImageCollection("COPERNICUS/S2_SR_HARMONIZED")
              .filterBounds(roi.buffer(500))
              .filterDate(start, end)
              .filter(ee.Filter.lt("CLOUDY_PIXEL_PERCENTAGE", 30)))

ndvi = collection.map(lambda img:
        img.addBands(
            img.normalizedDifference(["B8", "B4"]).rename("NDVI")))

stats = ndvi.select("NDVI").median().reduceRegion(
        reducer=ee.Reducer.mean(),
        geometry=roi,
        scale=10).getInfo()
Filter by location and date, compute NDVI from bands B8 (near-infrared) and B4 (red), take the monthly median, extract the mean value over a 500-meter buffer around each site coordinate.
I had no training labels — no shapefile of confirmed invasive patches, no field survey data aligned to my sites. That ruled out machine learning. Instead, I wrote four hand-coded rules based directly on the phenological priors above: spring NDVI more than 0.10 above the native control, summer absolute NDVI above 0.85, autumn NDVI more than 0.10 above control, winter NDVI above 0.40. A site is classified as invasive if it trips any single rule.
The First Result
| Site | Known invasive | v1 result |
|---|---|---|
| Huntley Meadows (Phragmites) | ✓ | ✓ Detected |
| Scotts Run (English ivy) | ✓ | ✗ Missed |
| Dyke Marsh (Phragmites) | ✓ | ✗ Missed |
| Great Falls (Kudzu) | ✓ | ✗ Missed |
| Manassas Battlefield (native) | — | ✓ Correct (not flagged) |
One hit. Four misses. A 20% detection rate on the invasive sites.
The obvious conclusion would be that phenology-based detection doesn't work — that the hypothesis was wrong, the thresholds were wrong, the data wasn't good enough. Close the notebook and move on.
But before I closed the notebook, I looked more carefully at the four sites I'd missed. They weren't all wrong in the same way — and that difference turned out to matter.
Wenxuan Tang · DC area · Interactive dashboard