NOVA Invasives
Detecting kudzu, phragmites, and other invasive species in Northern Virginia by exploiting their phenological signatures in Sentinel-2 time series — all processed on Google Earth Engine.
Study Area
5 Monitoring Sites
Click each marker to see the invasive species, GEE coordinate code, and detection signature. The dashed green box is the bounding box for the full study area.
Why It Works
How can a satellite see invasive plants?
The key is phenological asynchrony: invasive and native plants leaf out and senesce on different schedules, and that timing gap is clearly visible in satellite time series.
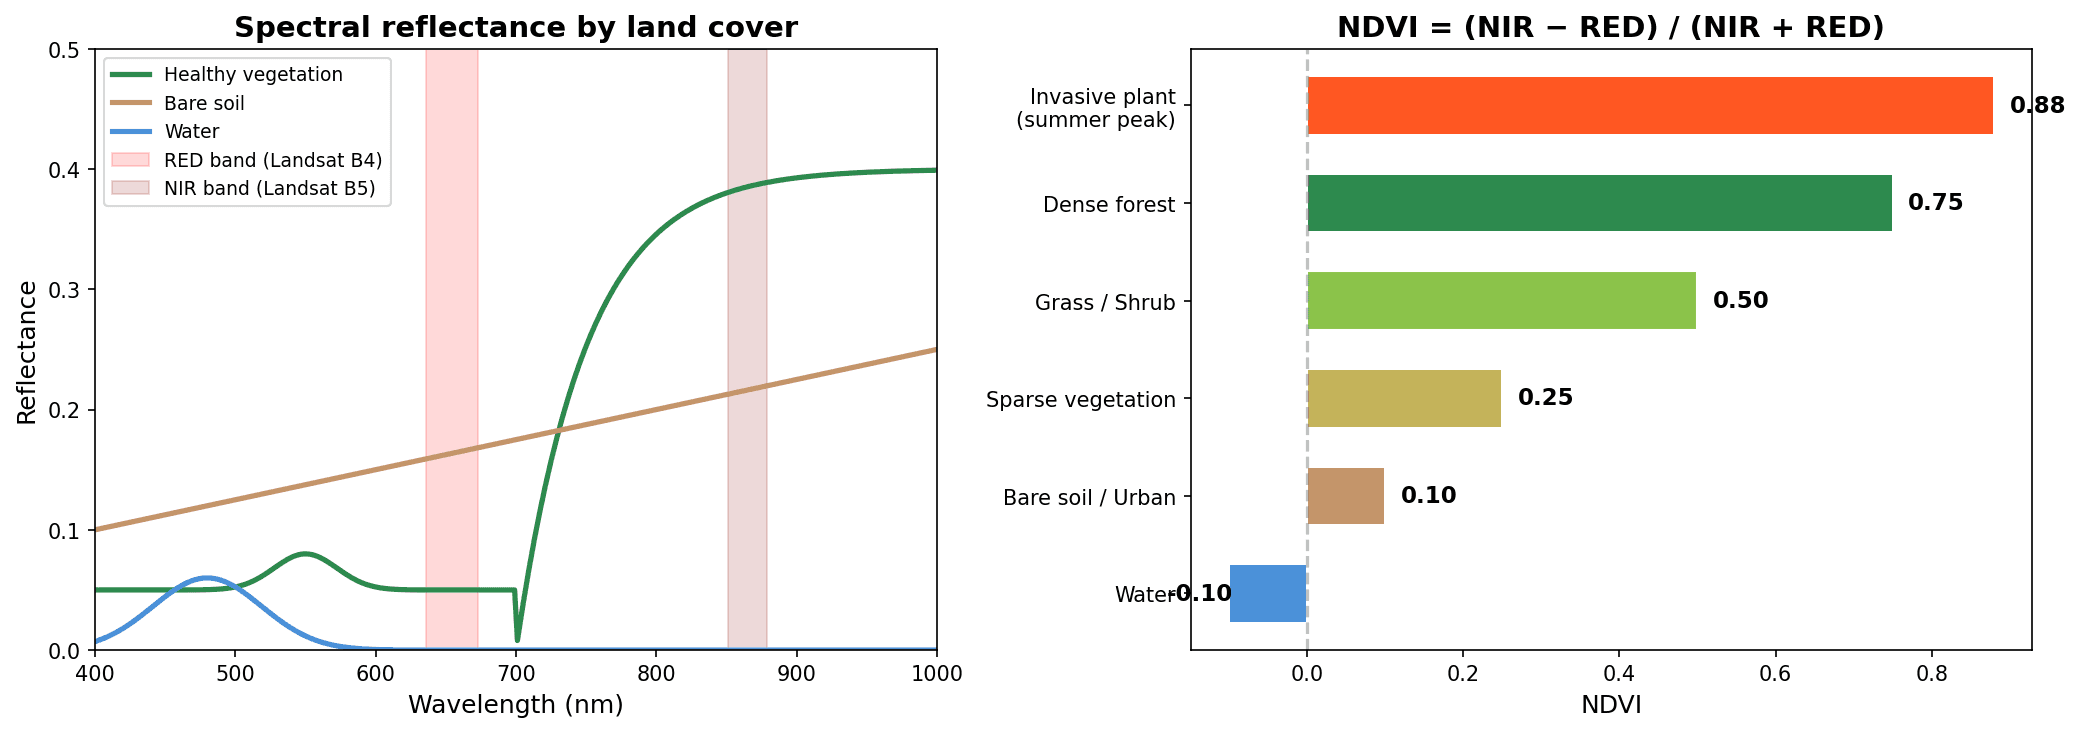
What is NDVI?
NDVI = (NIR − RED) / (NIR + RED)
Plant leaves absorb red light for photosynthesis and strongly reflect near-infrared. NDVI normalizes that ratio to [-1, +1] — higher values mean denser vegetation. Sentinel-2 uses B8 (NIR) and B4 (Red).
Detection Windows
Early Spring (Mar–Apr) · Late Autumn (Oct–Nov)
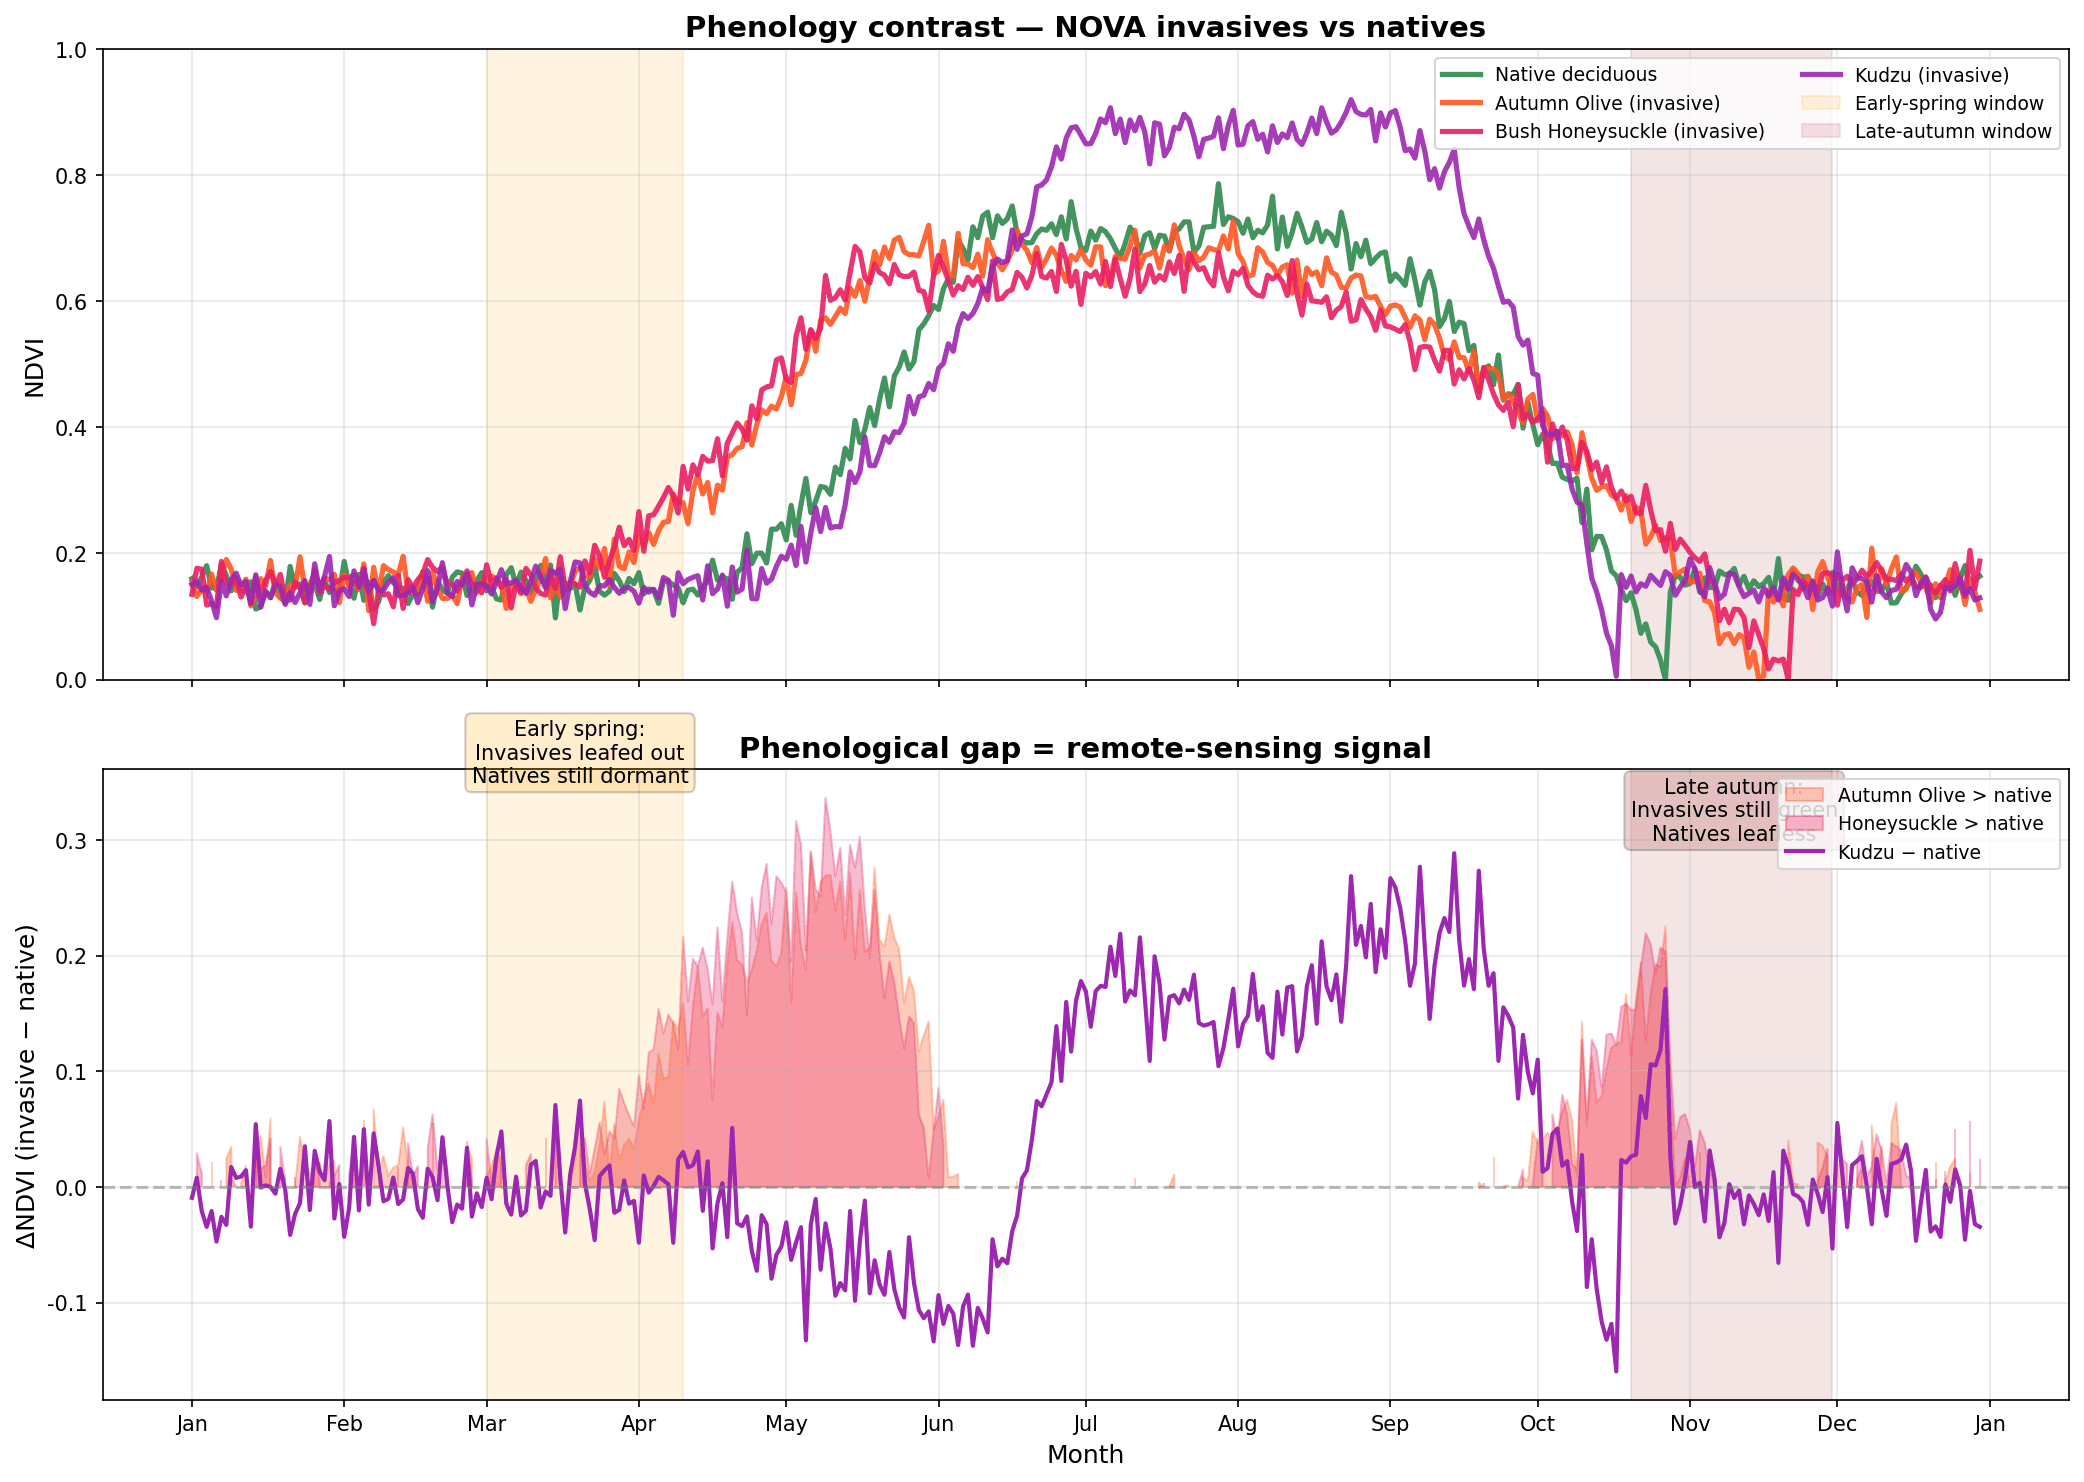
Invasive shrubs leaf out 2–3 weeks earlier and drop leaves 2–3 weeks later than native deciduous trees. During those windows, invasives show much higher NDVI than surrounding native vegetation — a detectable signal.
Simulation
Phenology Curve Comparison
Synthetic data confirming the core hypothesis: the orange (early spring) and brown (late autumn) bands mark the windows where invasive vs. native NDVI differs most.
Kudzu
Pueraria montana
Anomalously high summer NDVI (>0.8)
Year-roundAutumn Olive / Bush Honeysuckle
Elaeagnus / Lonicera
Leafs out 2-3 weeks earlier than natives
Mar–AprPhragmites
Phragmites australis
Persistently high NIR reflectance
Late summerEnglish Ivy
Hedera helix
High winter NDVI (evergreen)
Dec–FebReal Data
NDVI Time Series — 5 Sites (Sentinel-2 measurements)
Real data from Google Earth Engine: 360 monthly observations across 2020–2025. Switch to 'Monthly phenology' for multi-year averages, or 'Full time series' for raw monthly values. Toggle sites via the legend.
Source: COPERNICUS/S2_SR_HARMONIZED · 500 m buffer · monthly median composite · cloud cover < 30%
Classification
Automated Phenological Classification
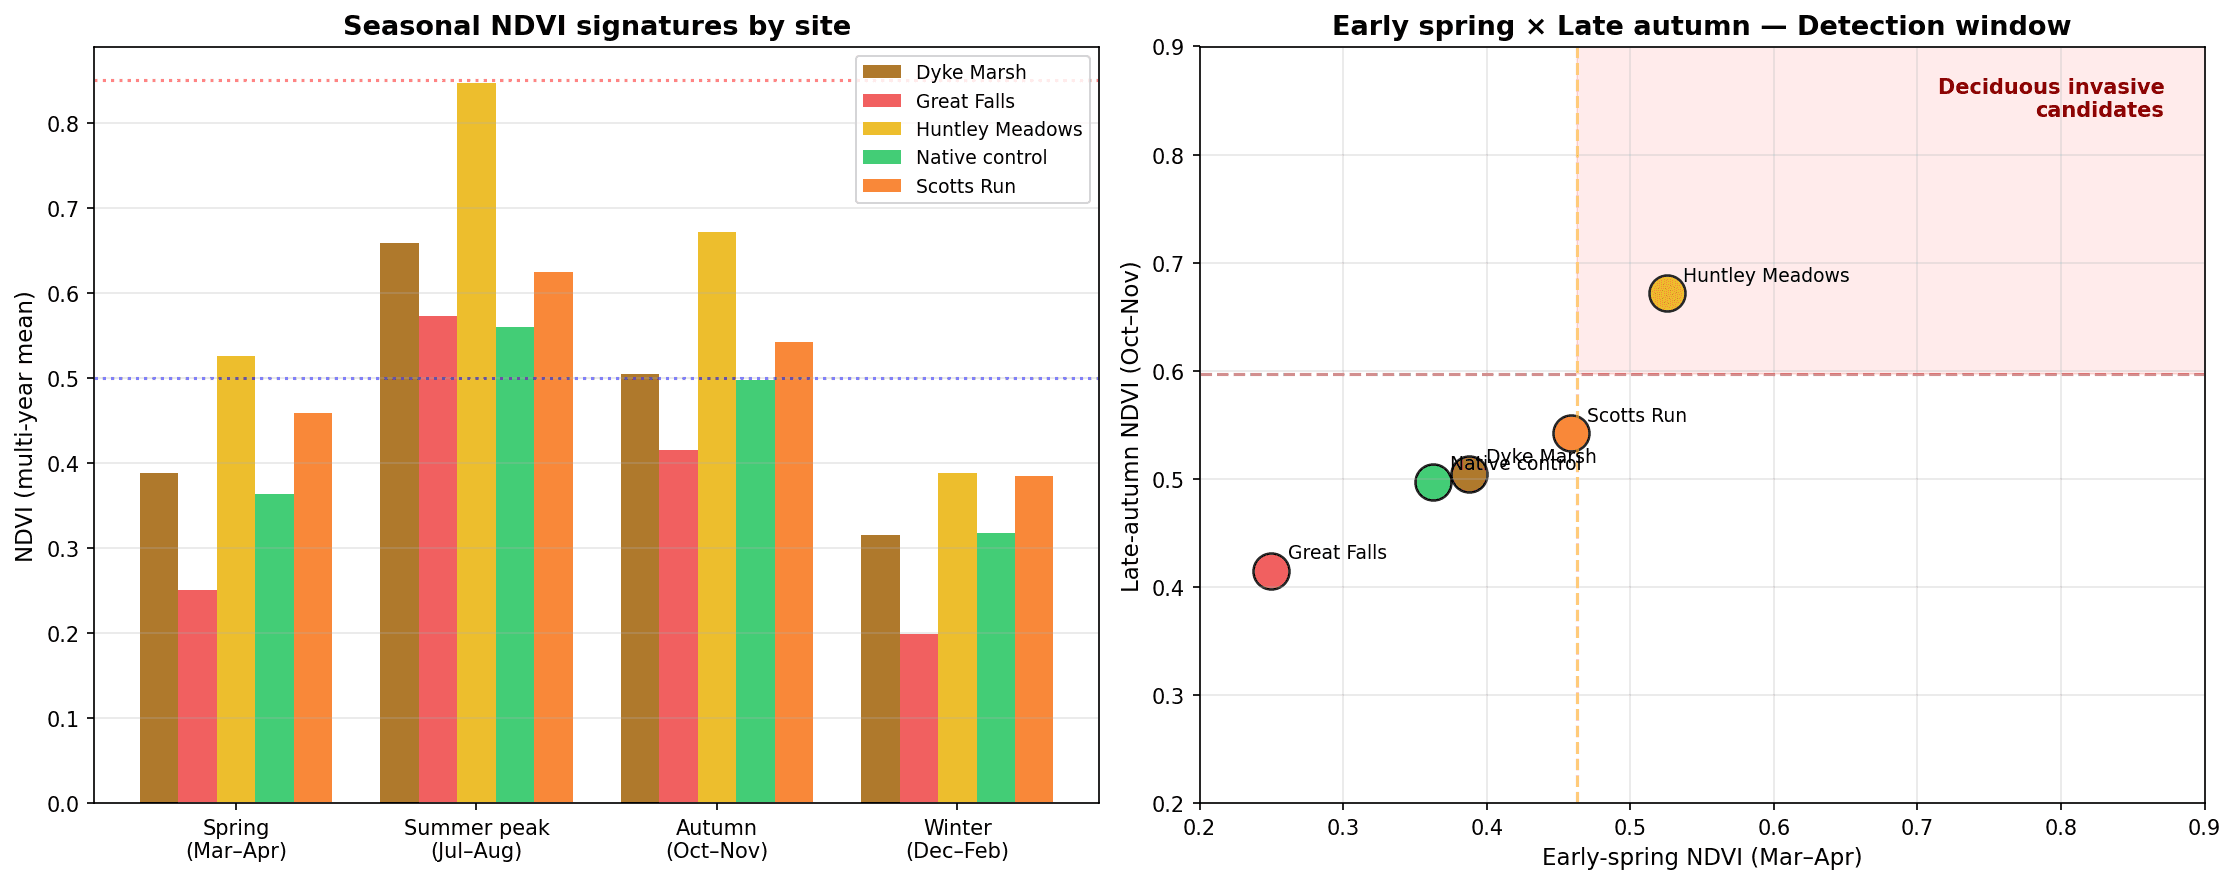
A rule-based classifier (no training data needed) evaluates four seasonal NDVI features per site. Rules encode ecological priors: early leaf-out, late senescence, winter evergreen, summer explosion — any one exceeding the native baseline flags the site as invasive.
Dyke Marsh — Phragmites
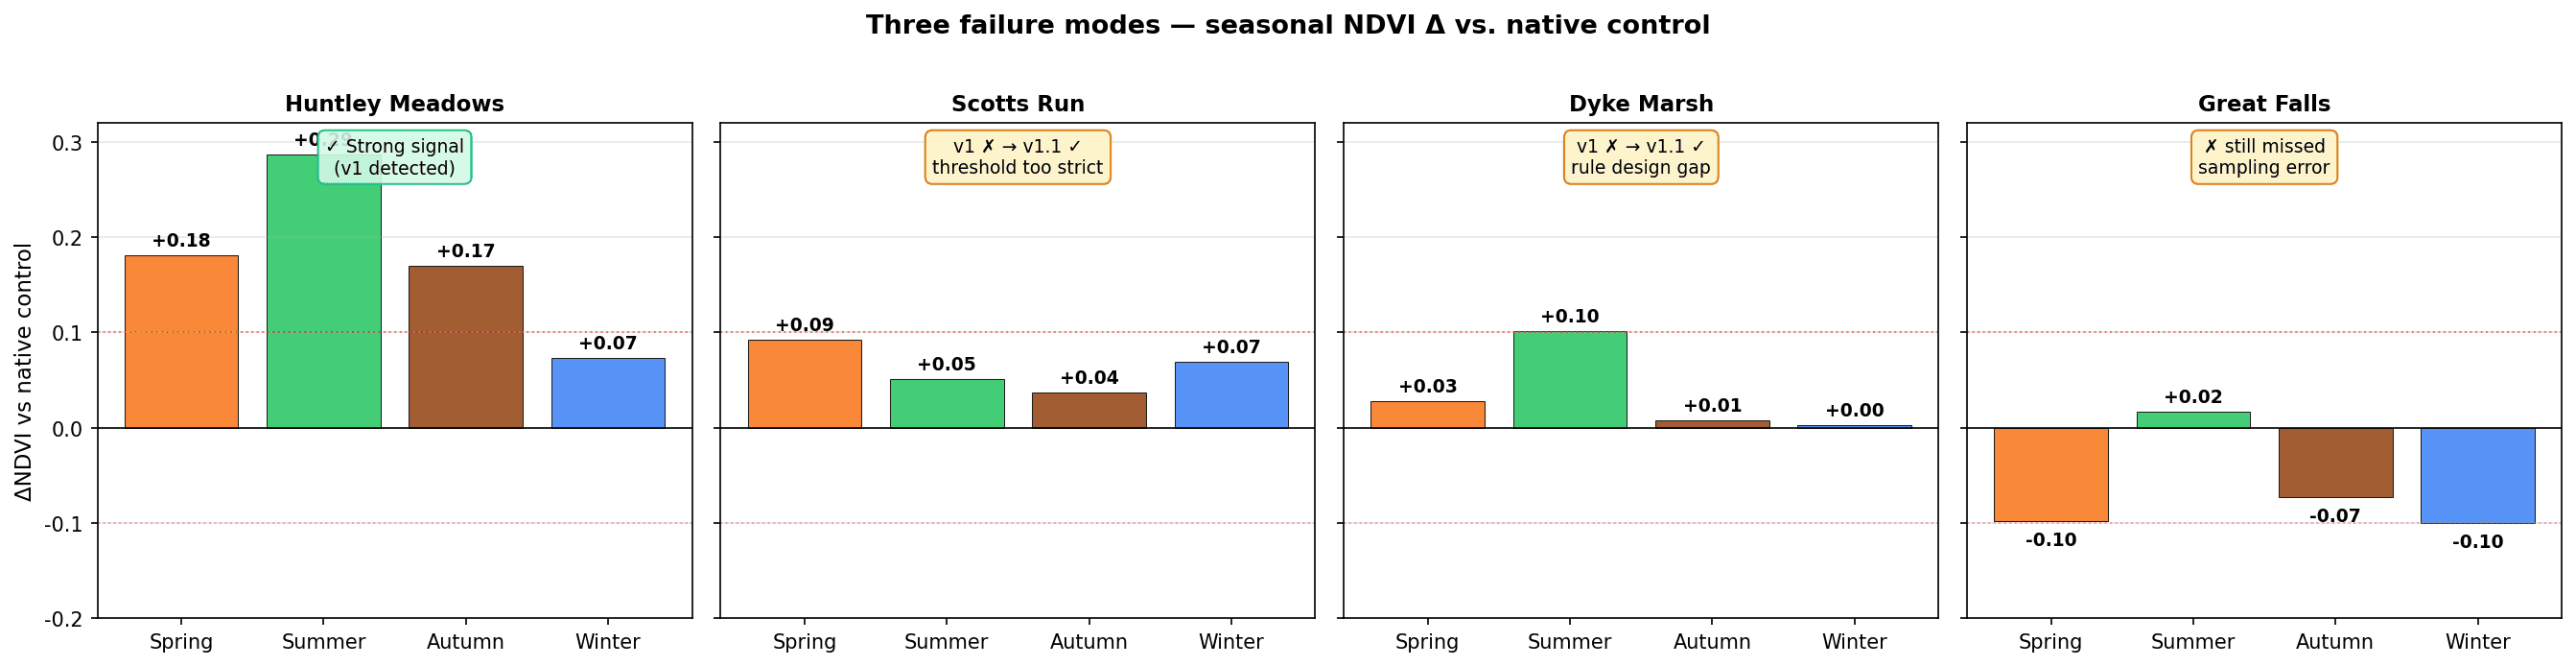
Suspected invasive (single signal)- Summer + +0.10 above control (relative summer surge)
Spring
0.401
Summer
0.660
Autumn
0.505
Winter
0.308
Great Falls — Kudzu
Native vegetation- All metrics close to the native control
Spring
0.274
Summer
0.575
Autumn
0.425
Winter
0.206
Huntley Meadows — Phragmites
Deciduous invasive shrub (Autumn Olive / Honeysuckle-type)- Summer + +0.29 above control (relative summer surge)
- Early-spring + +0.18 above control (early leaf-out)
- Late-autumn + +0.17 above control (delayed senescence)
Spring
0.553
Summer
0.845
Autumn
0.668
Winter
0.378
Native Forest (Control)
Native vegetation- All metrics close to the native control
Spring
0.372
Summer
0.558
Autumn
0.498
Winter
0.305
Scotts Run — Ivy
Broad mild invasive (composite signal)- All seasons mildly elevated (ΣΔ=+0.25, 4/4 seasons > control)
Spring
0.465
Summer
0.610
Autumn
0.535
Winter
0.374
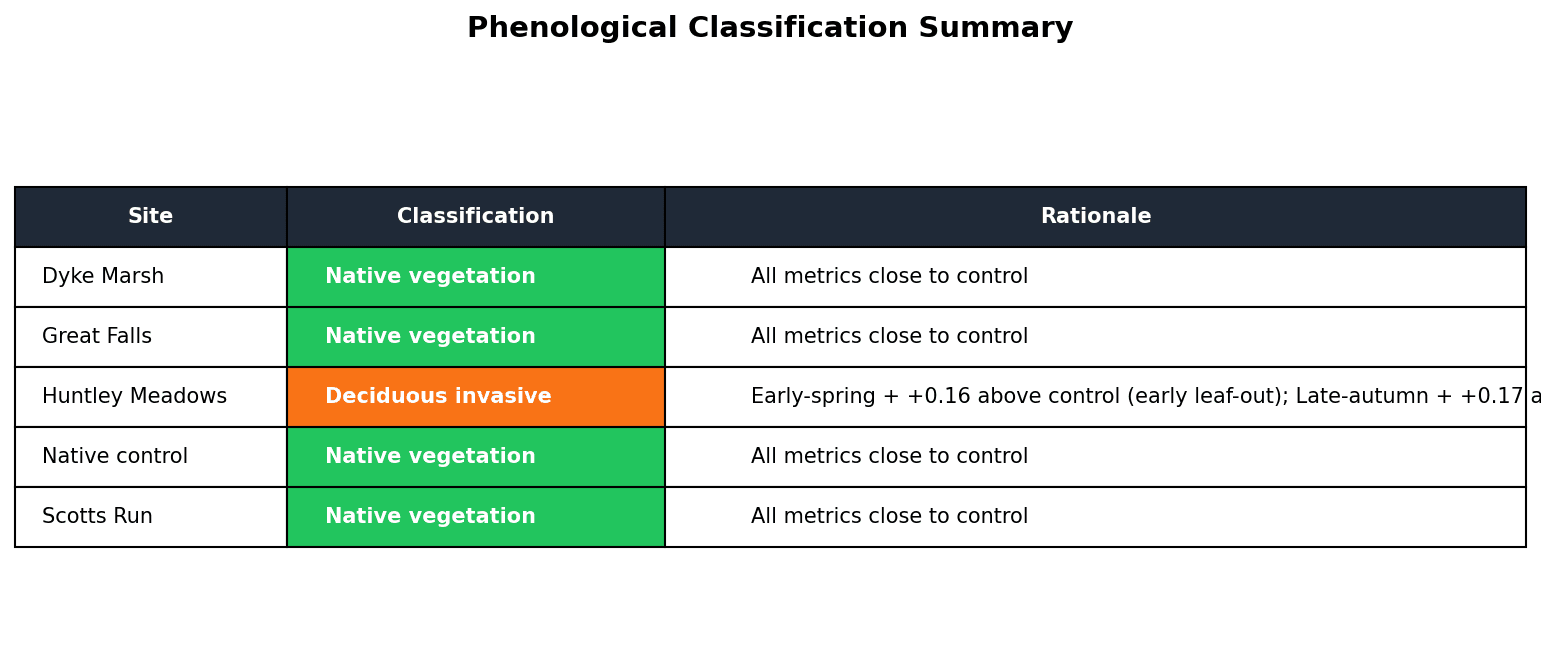
⚠️ Three failure modes diagnosed (v1 → v1.1)
v1 (initial rules) detected only 1 of 5 sites (Huntley Meadows). Diagnosing the 4 misses revealed three distinct failure mechanisms: (1) Scotts Run — threshold too strict: all 4 seasons +0.05–0.10 above control but no single feature breaks the wall; (2) Dyke Marsh — rule gap: summer +0.10 vs. control but the old rule only checked absolute value; (3) Great Falls — sampling error: the chosen coordinate sits on bare rock / river surface, not on the kudzu patch (shrinking the buffer to 100 m made it worse, confirming this). v1.1 added composite and summer-vs-control rules, lifting detection from 1/5 to 3/5. Great Falls needs a new coordinate — no rule change can fix a wrong sampling point.
Project Scripts
Analysis Pipeline
Four Python scripts form a complete analysis pipeline, one stage each.
Understand NDVI
01_explore_ndvi_concept.pyPlots the NDVI definition and simulated phenology curves for invasive vs. native plants.
Why this way: Before pulling real satellite data, make sure we know what we're measuring. No GEE account required.
Output: 01_ndvi_concept.png · 02_phenology_comparison.png · 03_study_area_map.html
Extract real NDVI via GEE
02_gee_ndvi_timeseries.pyConnects to Google Earth Engine and pulls monthly NDVI time series (2020–2025) for 5 sites from Sentinel-2.
Why this way: Sentinel-2 overpasses every 5 days — hundreds of scenes over 6 years. GEE parallelizes this in the cloud; nothing is downloaded locally.
Output: ndvi_timeseries_nova.csv · 04_gee_ndvi_timeseries.png
Download Landsat via STAC
03_download_landsat_stac.pyPulls raw Landsat 8/9 bands via the USGS STAC API and computes seasonal NDVI maps locally.
Why this way: STAC needs no GEE account — useful fallback. Landsat 30 m is suited for regional-scale analysis.
Output: data/*.tif · outputs/ndvi_*.png
Phenological classification
04_phenology_analysis.pyUses early-spring / late-autumn NDVI deltas as features in a rule-based classifier; exports JSON for the dashboard.
Why this way: This is the project goal: turn time-series signals into a yes/no invasive flag per location.
Output: phenology_features.csv · classification.json · 05/06_*.png
# 1. Load the Sentinel-2 dataset (lazy — nothing is downloaded yet)
collection = (
    ee.ImageCollection("COPERNICUS/S2_SR_HARMONIZED")
    .filterBounds(roi)              # (1) keep only scenes over NOVA
    .filterDate("2022-03-01", "2022-04-30")  # (2) early-spring window
    .filter(ee.Filter.lt("CLOUDY_PIXEL_PERCENTAGE", 30))  # (3) drop cloudy scenes
)

# 2. Compute NDVI on every image (runs in parallel on GEE servers)
def add_ndvi(image):
    return image.addBands(
        image.normalizedDifference(["B8", "B4"]).rename("NDVI")
    )

# 3. Composite + extract a single value (this is where the actual call happens)
ndvi_median = collection.map(add_ndvi).select("NDVI").median()
stats = ndvi_median.reduceRegion(
    reducer=ee.Reducer.mean(),
    geometry=roi,    # 500 m buffer
    scale=10,        # Sentinel-2 native resolution
).getInfo()          # ← only this line triggers actual GEE computation
Technology
Sources: Copernicus Sentinel-2 · USGS Landsat · EDDMapS · iNaturalist
Study area: Northern Virginia (38.70°N–39.00°N, 77.00°W–77.55°W)